This Website is not fully compatible with Internet Explorer.
For a more complete and secure browsing experience please consider using Microsoft Edge, Firefox, or Chrome
Principles and Metrics for Curating Large Structural Simulation Data sets for Machine Learning
Jami J. Shah, The Ohio State University
Abstract
Machine Learning applications are using a wide variety of data sources, some real, such as data collected by sensors and cameras in driving, and some artificial, such as data generated through numerical simulations. The latter mode has been gaining rapid popularity for structural design and analysis. Early work in this arena seemed to center on the data being generated by developers of ML applications themselves. While the need for confidentiality of proprietary data may continue to drive this trend, we are seeing the beginnings of publically shared data sets, such as CarHoods10k from Honda and BIKEE from MIT. Artificially generated data sets need to be curated following systematic principles and evaluated with appropriate efficacy metrics. In this presentation, I will discuss insights we have gained from multiple data curation projects in collaboration with Honda companies and funding from the US National Science Foundation.
In the context of ML, Data Curation is “the generation, structuring, labelling and integration of data collected from various sources together with the capacity to add value to data". Data curation cannot be done in a vacuum – it must be done in conjunction with project objectives and ML algorithm capabilities. Common engineering objectives are data driven structural evaluation, manufacturability evaluation, cost estimation, configuration synthesis or optimization. Unlike millions of unrelated random geometric objects stored in open source sites, such as OnShape, engineers are interested in analyzing or selecting from component geometries designed for the same functional requirements. Thus, specialized data sets must be curated to contain design variants that meet the same constraints and meant to operate under the same initial conditions or boundary conditions. The training data must have performance characteristics of each variant, which can be obtained by simulations performed on each variant in a consistent manner. So similar to any design or optimization methodology, we have two sides of the data: input (characteristics of the design variants) and response (performance attributes).
In this talk, I will address issues related to generating BIG datasets from CAD and FEA; Granularity and Modality, applicable to both input and output data; variety and balance, applicable to input data; validity applicable to output.
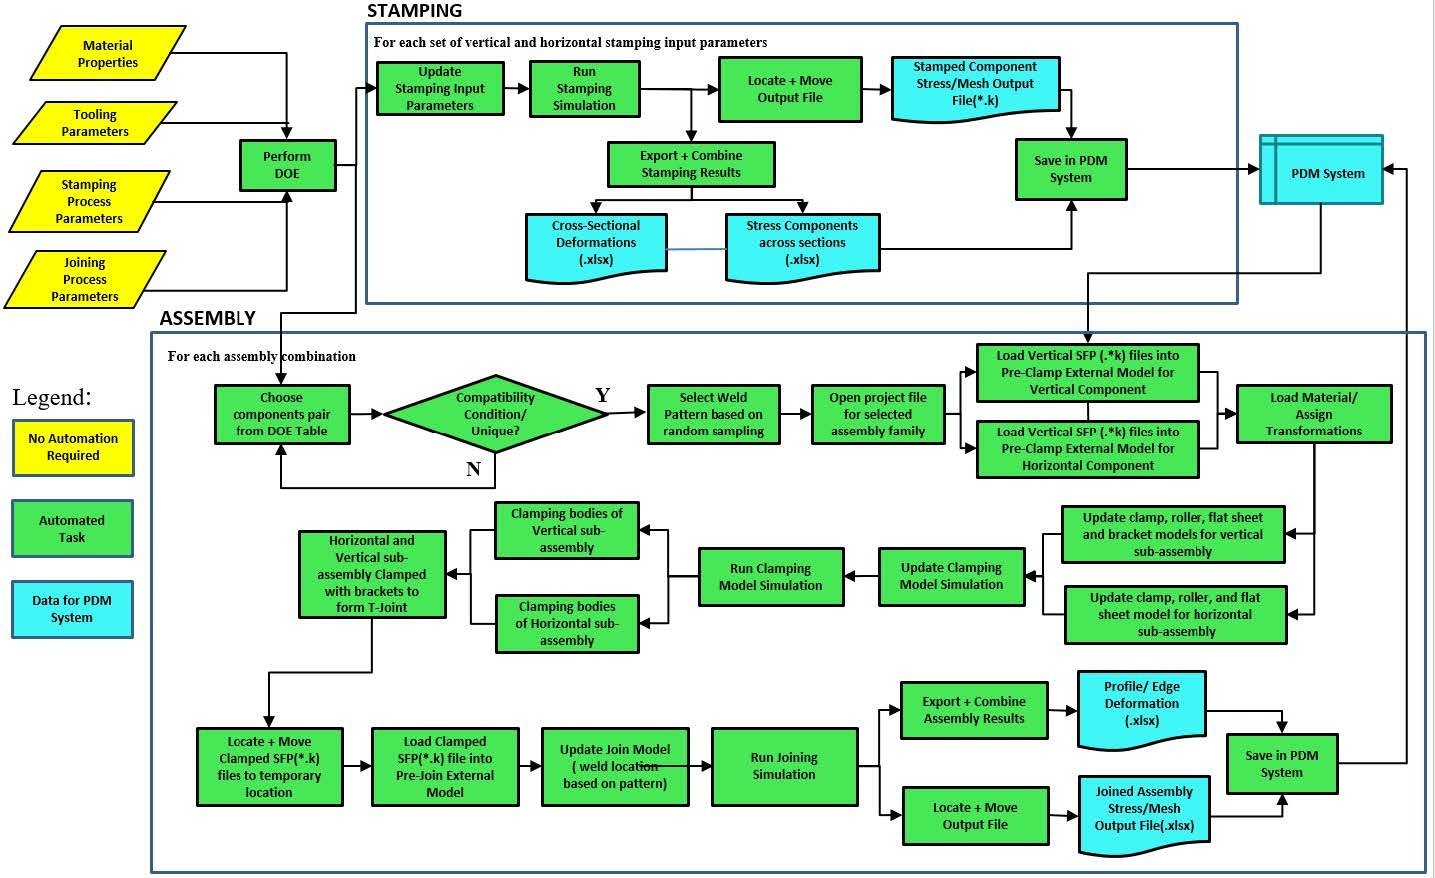
Generation of Big Data by simulation requires the use of commercial CAD and FE packages, which poses multiple challenges: automation, integration and balancing variants. One needs to identify parameters, features, attributes that can be varied. Automating the simulation pipeline is necessary because it is not practical to generate and simulate thousands of design variants manually. It may not always be possible to do geometry creation and simulation in one package. In the CarHoods10k we used Catia for geometry creation via Power Copies and macros, DOE Tables to get parametric variants and Ansys Design Explorer and Mechanical for simulation. CADNexus software created the bridge between Catia and DesignExplorer. In other projects, several Python scripts and Excel were used for transferring and transforming data across the pipeline. How do you guarantee that your automated procedure will not fail upon execution in CAD and generate valid geometries?
Modality: The geometry of mechanical structural components can be represented as full 3D solid BRep (CAD model), as multiple 2D images from different angles, as voxels or point clouds, STL, FE mesh, pixelated images, etc. Depending on types of elements used, we may even have non-manifold geometry.
On the response side, the data could be jus textual, such as the max vM stress and its location, total strain energy, etc. or we could have the full stress, strain field mapped onto deformed geometry. Archiving and publishing data at multiple modalities can be attractive to ML researchers: they could pick and choose the appropriate abstractions, partitions, representations most suitable for use in training or benchmarking their own algorithms.
Data Granularity: Another issue I will address is about the resolution or level of detail in the data models (granularity). This directly impacts the data storage space needed. We need to find the right balance between size and meaningfulness of the data for ML. To illustrate this idea, I will discuss two past experiments; one in which STL files were used from Topology Optimization and in bitmap images of geometry reduced many folds without losing any geometric features that affect stiffness and stress.
As evident from the foregoing, there are varied contents, so the data set needs to structured with relevant associativity. This is similar to use of PDM systems in engineering companies. The syntax, file formats and semantics need to be well documented for public use.
Finally, I will touch upon quantifiable metrics of data efficacy: size, quality, validity and balance. For example, using Confusion Matrix to study over or under representation of input attributes. Even if we have a large data set with good balance, it may not be suitable for ML if we do not see significant variation in response or performance variables.