Fatigue Overview
The previous article described the assumptions and method of forming discrete closed stress-strain hysteresis loops or cycles from a simplified general loading cycle. More complex random load histories can be similarly broken down into (often a very large number of) such discrete cycles, and this is achieved in realistic applications, using commercial fatigue analysis software.
Each discrete load cycle, so identified, will use up a portion of the life of the structure. This life is readily determined, based only on the range of strain encompassed by each loop, and its mean. The portion of life used up (or ‘damage’ done) by each cycle can be expressed as a fraction of total life. In theory, failure of the structure subject to a complex load history, broken down into many such loops, occurs when the total damage is unity. This is the Palmgren-Miner Rule. Knowledge Base 016 introduced fatigue by way of material plasticity. This was a continuation of the discussions of both shakedown and plastic collapse, which both require a consideration of such material phenomena.
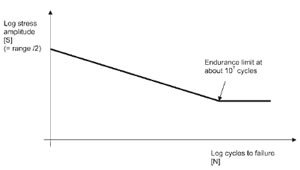
However, fatigue does not always require consideration of plasticity; if the load cycles do not cause the stresses to exceed yield at any point in the structure, the stress cycles, when plotted as stress-strain curves, do not form hysteresis loops. In this case, stress, rather than strain, is used to described the size of each cycle range, and its mean. The fatigue properties used in conjunction with such an approach are usually described with an S-N curve, a typical form of which is given in Figure 1.
Each point on the line identifies the number of cycles to failure for a fixed stress cycle range (with zero mean). Note that this is linear, but only when plotted on a log-log scale. As stated, the load cycles are smaller than those that would cause yield, so this approach is applicable when the number of cycles to failure is high. Steels are usually said to display an ‘endurance limit’, meaning if a load can be sustained for about 107 cycles, the life is infinite under this load range (equivalent to saying the damage is zero.

Figure 1: Typical S-N Curve for a Steel
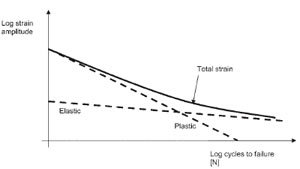
Conversely, larger cycles will give rise to hysteresis loops, as discussed in the previous article, and lower lives will occur. In such cases, the cycles are best described in terms of strain and the material data is more complex. In this case, a given strain cycle comprises an elastic part and a plastic part. And the corresponding fatigue life, for a fixed strain range, is then the sum of lives due to the elastic and plastic parts. This is shown in Figure 2.

Figure 2: Total Strain-Life Curve
Knowledge Base specified the types of materials to which this technique is applicable; essentially most steels and some aluminium alloys. A further limitation of this approach is that it is only uniaxial. That is, it only applies in cases when the loading gives rise to a cyclic principal stress in one direction (or strain, if plasticity occurs). Some cases of variation in loading direction can be considered using this approach. For example, cyclic bending of a shaft about two axes will cause the peak stress range location to be dependent on the relative magnitude of the two moments, but the stresses will always be orientated along the shaft longitudinal axis.
However, if the shaft were to be subject to torsion as well as bending, then a biaxial stress state will arise. Of the biaxial fatigue approaches that could be applied in this situation, a simpler approach would suffice if the torsion and shear loads are always in the same ratio, since changes in orientation would not have to be considered.
Empirical evidence indicates that a uniaxial fatigue analysis is not even suitable as an approximate method for solving fatigue problems in which biaxiality exists, since actual fatigue lives can be much shorter than uniaxial fatigue analysis often predicts.
Perhaps more startlingly, at stress concentrations or notches, uniaxial loading can also give rise to biaxial stresses. However, this situation can usually be tackled by understanding that fatigue failure in many engineering materials, shows similar behaviour to that due to a single load application, in as much as failure occurs on a plane of maximum shear stress. In this case, providing principal stresses and directions are correctly evaluated, biaxial stresses caused by a uniaxial load can be assessed using a uniaxial fatigue approach.


