Hysteresis in Fatigue
If the yield stress is exceeded at notches in a structure, hysteresis loops of various sizes will be traversed at points around the notches. Providing the load is not too large, shakedown is achieved, in which the loops stabilise at all points, after a small number of cycles. But sustained repetition of this load of typically, between 102 and 107 cycles, will have to consider the separate and longer-term phenomenon of fatigue damage.
Aside from Young’s Modulus and Poisson’s Ratio, the material properties required for a shakedown analysis are the yield stress and the post-yield stiffness. Fatigue behaviour is described by further material constants, but these are not required in the main FEA solution phase.
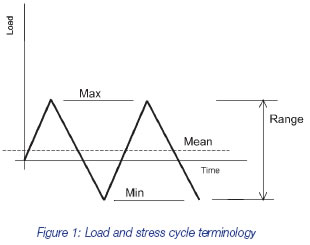
In fatigue, loads are cyclic and fatigue damage at a point is strongly related to the range of stress encountered during a given load cycle, rather than the peak stress due to the extreme of the cycle. Each stress cycle will damage the material by a small amount, eventually causing cracks to form. Generally, no account is made of the shape of each individual peak to peak load (and corresponding stress) and, for a sequence of different load ranges, no account is made of the order in which the loads are imposed. Figure 1 shows common terminology used to describe load or stress cycles.

It will be obvious that although the range of stress might be the most important determinant of fatigue damage, the mean stress value must have some effect. This can be conveniently considered separately, however; the main effort in a typical fatigue analysis is expended in isolating the discrete stress ranges within a complex load cycle, with each cycle’s mean stress accounted for separately.
The fatigue life of ferrous and some aluminium alloys can be predicted based on the following assumptions. For other material including cast irons and other aluminium alloys, at least some of these assumptions are not valid, so fatigue lifing may not always be viable for such materials:
- Life is defined by material properties, that is, quantities that are assumed constant for a given material. These are obtained from cyclic loading or straining of specimens of the said material. There is a greater amount of scatter of fatigue life data from material specimens than of say, stiffness. Such scatter may be accounted for by taking the mean minus two standard deviation life or other statistical approaches.
- For a fixed, repeatedly applied load cycle, the hysteresis stress-strain curve at any point will not change, until failure begins. This is termed cyclic stability. In reality, hardening or softening may occur initially, so a specimen hysteresis loop changes shape, but this stabilises after a few cycles and is one aspect of shakedown behaviour, already described.
- The memory effect underpins the range counting techniques used in fatigue analysis. This implies that any complex sequence of load cycles will give rise to several complete (closed) hysteresis loops corresponding to each peak to peak excursion. Thus, the damage due to each loop is related only to the size of that loop, independently of the other loops or their relative position. This is explained in more detail below.
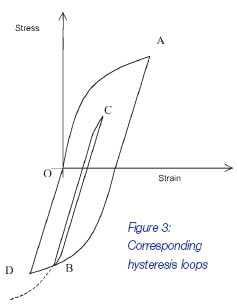
The hysteresis loops described in previous articles used straight line portions, indicative of the typical bilinear stiffness representations used in FEA. Real hysteresis loops are curved, as shown in Figure 3. This figure shows the hysteresis loop B-C-B enclosed within the loop O-A-D-O.

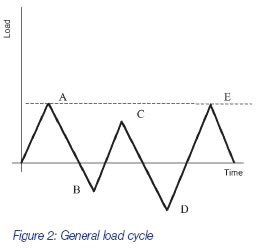
Figure 2 shows a load cycle in which several stress ranges could possibly be considered in a damage calculation, such as O-A, C-D and D-E. But the actual ranges chosen for the damage calculation will be those that give rise to closed hysteresis loops. At point B in Figure 2, the load reversal causes a new hysteresis loop to be started in Figure 3. At some point between C and D in Figure 2, the B-C-B loop in Figure 3 will be closed. The stress strain curve does not follow the continuation of the CB curve, shown dotted, but instead resumes the continuation of the A-B loop, until the load at D is reached. This is the memory effect. Hence the ranges to consider in the ensuing fatigue calculation are A-D and B-C.

Go to the next Knowledge Base article: Fatigue Overview or go back to Knowledge Base article series list


